Base Count
Base Structure
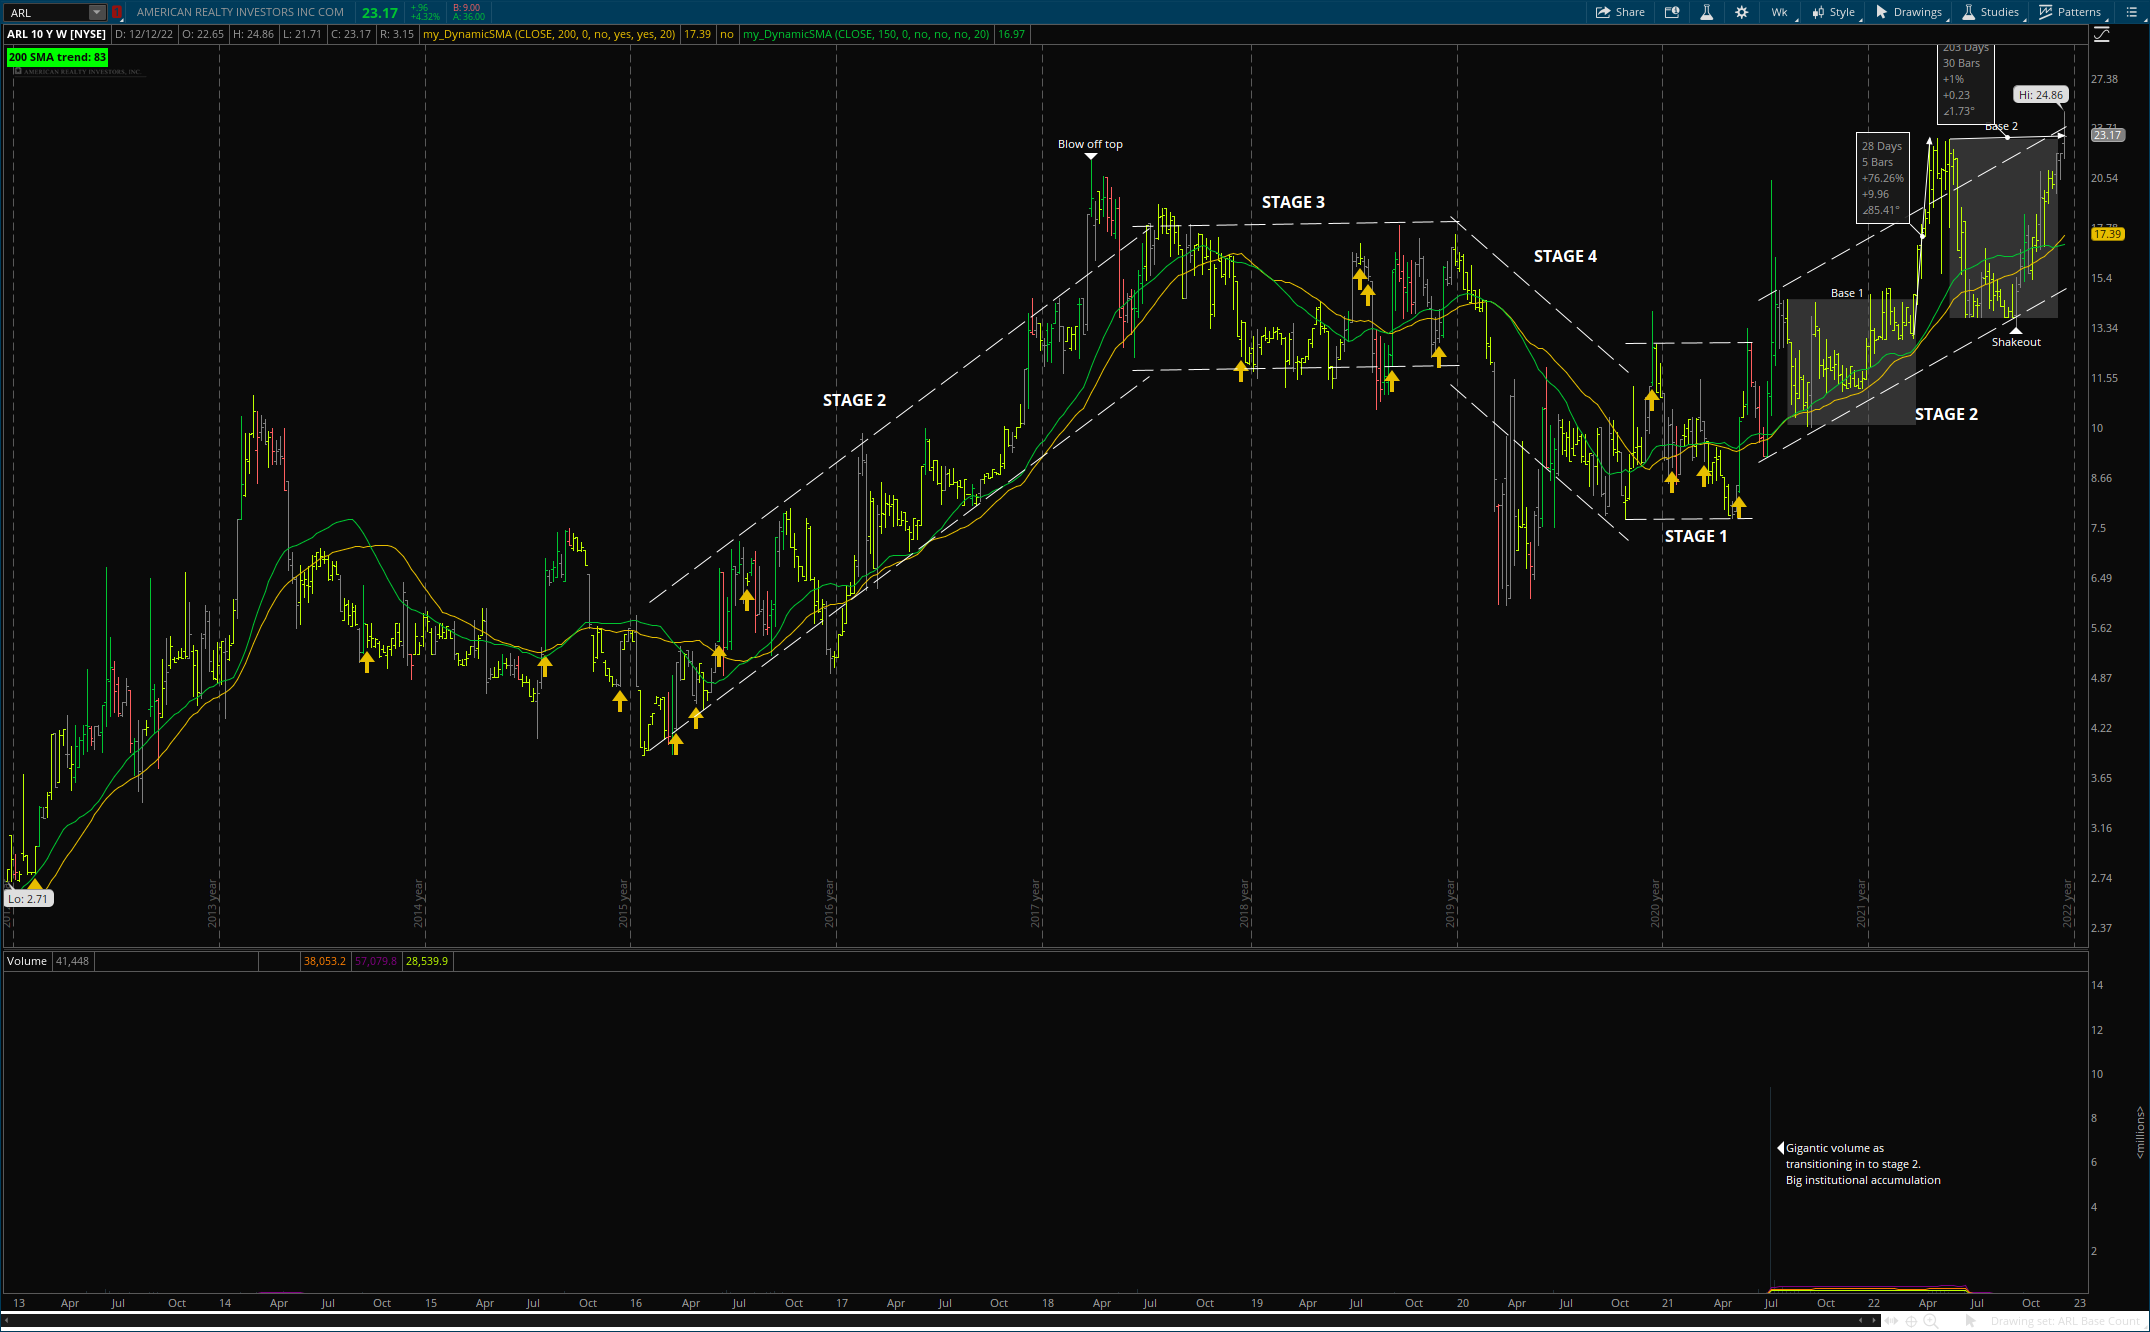
| Identifiable base on weekly and daily | Yes, currently appears to be in base 2 |
| Prior up-trend of at least 30% | Yes, 76.26% |
Length of base
At least 9 weeks ascending base At least 7 weeks for all other bases | 30 weeks |
Contain elements of strength:
RS at new high tight price ranges KO Recoveries | RS at 52-week high, several KO recoveries and gap ups. An earlier gap up at the lows of the base was on big volume. The most recent was on very low volume |
Contain elements of support:
Base on top of base Price above 40-week MA | Price above 40-week MA, but 30-week MA has crossed below it. That could signify some short-term weakness. Huge volume as transitioning from stage 1 to the current stage 2. Show of institutional support. |
| Shakeout near low of base | Yes, at bottom most price range of base |
| Handle area within upper half of base that drifts down on lower-than-average volume | Yes, but volume is not low. |
| Volume surge of 50% above average at pivot | The pivot hasn’t formed yet. |
Fundamentals
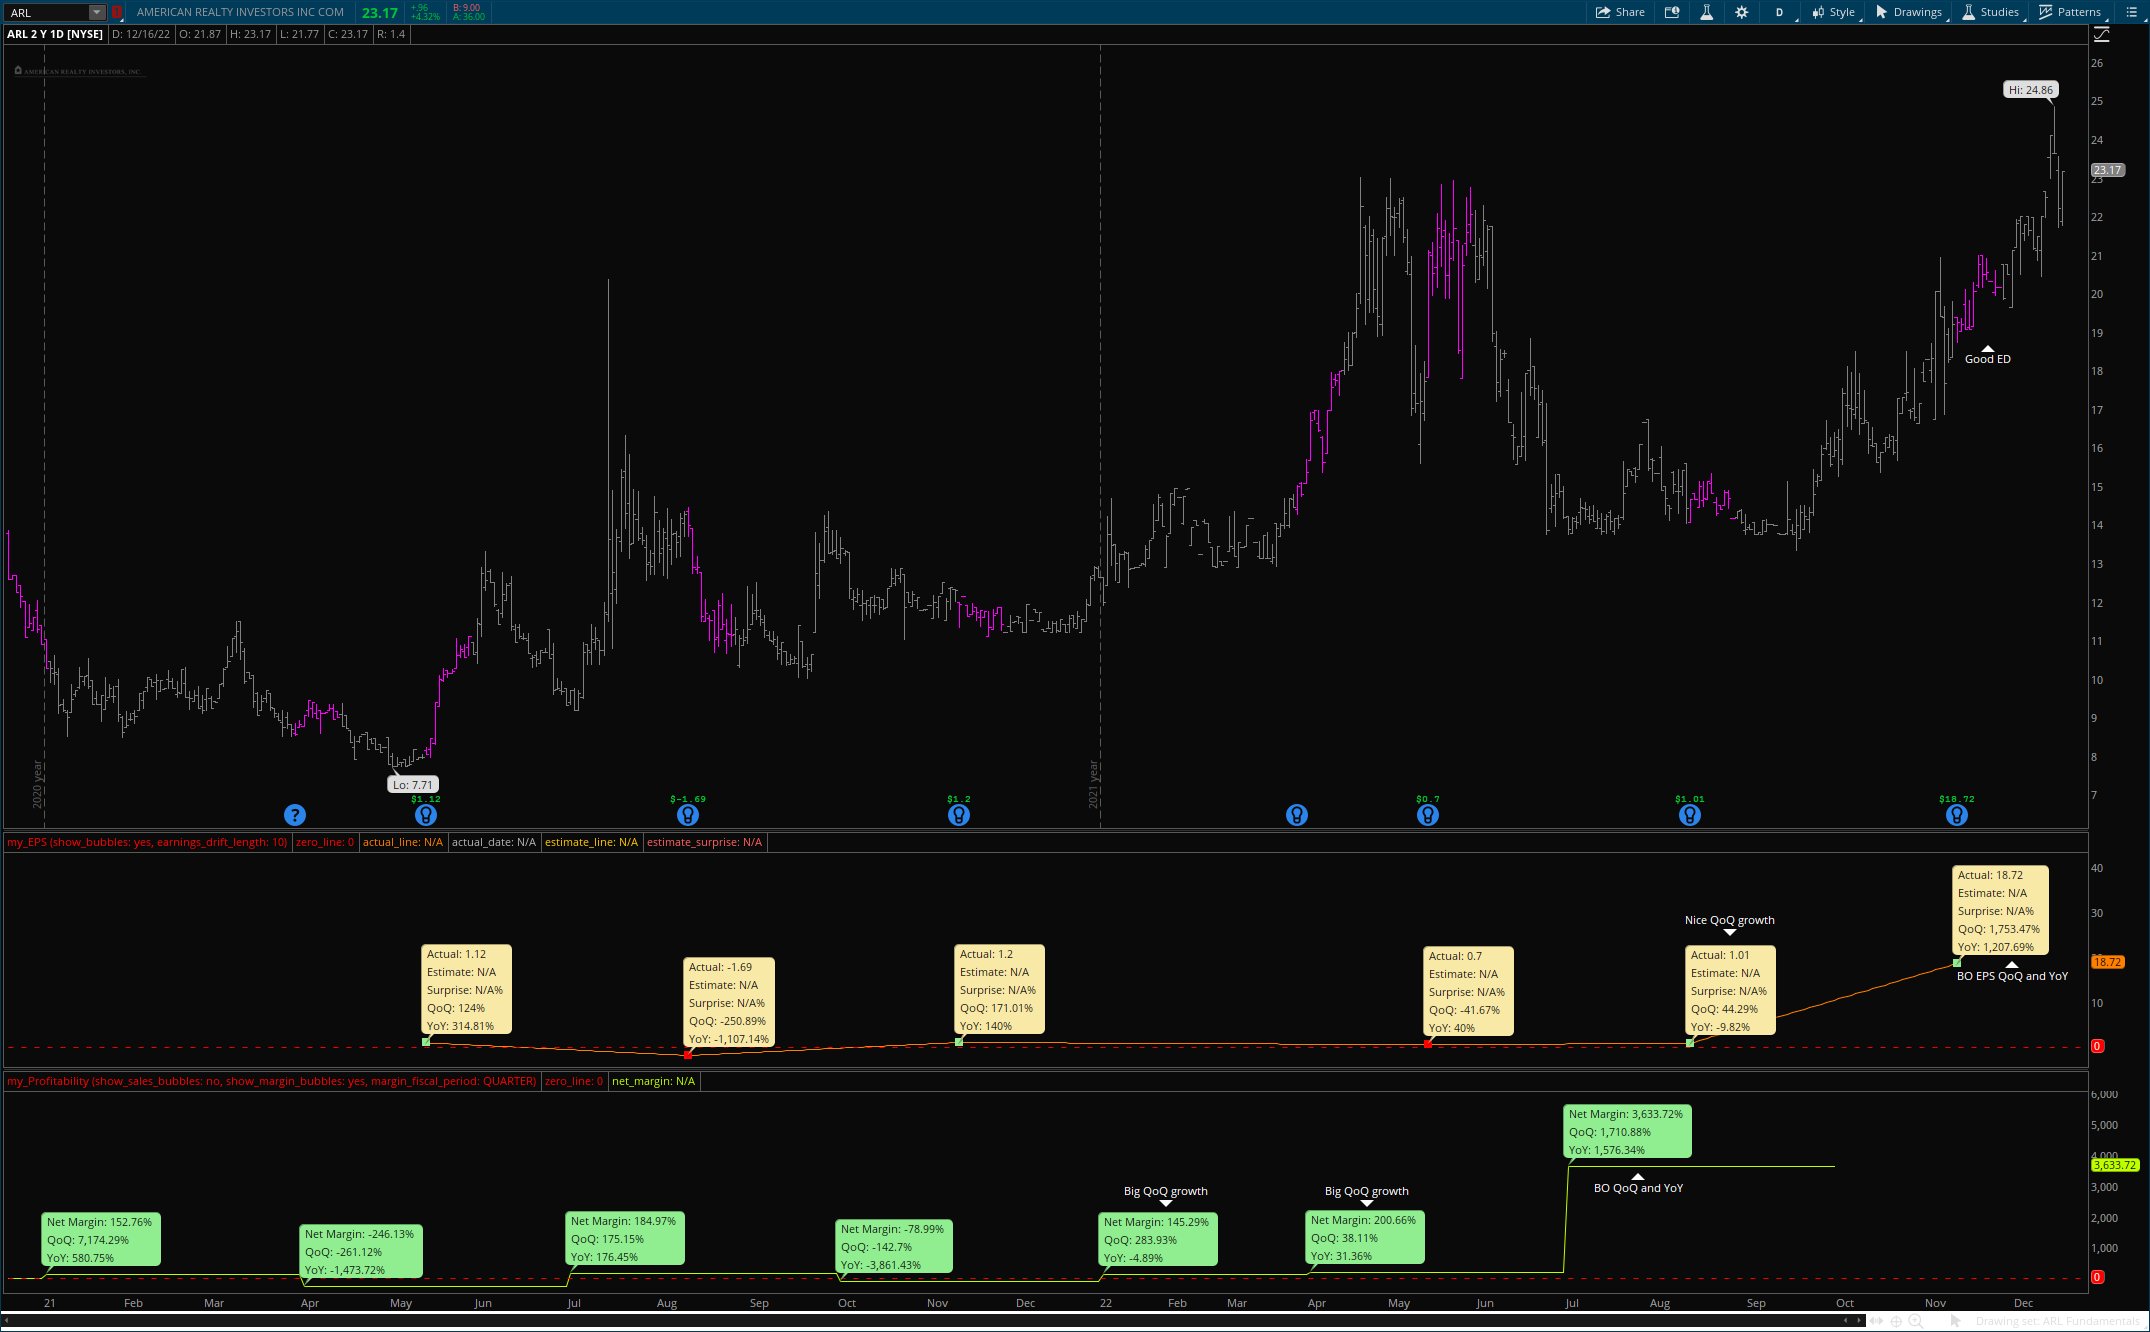
| Past 2 quarters EPS growth >= 25% | Yes, 44.29% and 1753.47% |
| Past 2 quarters margin growth >=25% | Yes, last 3 Q’s. 283.93%, 38.11% and 1710.88% |
| EPS growth >= 25% in past 3 – 5 years | No, the previous Q was -9.82% growth, but 3 of the past 4Q’s showed good growth |
| EPS surprises | Not sure. I don’t have the estimates to know |
| EPS break out | Yes, huge BO in the last Q |
| ROE >= 17% | Yes, current ROE is 79.448% |
| Earnings drift | Yes, after last Q’s earnings it made a new all-time high |
Technicals

The RS is 81.47% above the SPX and 89.89% above the rest of the Real Estate sector. However, the Real Estate sector is weak against the SPX, at 10.31% below it. The RS is strong, but I worry about it being held back in a weak sector.
It looks like a solid C&H formation. I’m watching the area noted to see if that is the handle forming. As of now the price range and volume is too large. If it continues to drift down with tightening ranges and lowering volume, it could become a good low risk setup.
The other factor is the overall weakness in the market right now. On the other hand, that could work to the patters advantage as the overall weakness could coincide with the drift down that the handle needs. Another note is that the 150-day MA looks like it may cross below the 200-day. That would indicate some shorter-term weakness that would also work nicely into that drift.
Cup Criteria
| >= 30% uptrend prior to cup with improving RS and increases in volume | Yes, prior uptrend was 63.73%. RS increased 59.23% during that time and 50-day average volume trended higher. |
| 7 – 65 weeks (typically 3 – 6 months) | Yes, this has been a long base. It’s currently been forming for over 199 days. |
| Correction from top to bottom of cup is 12-33% | No, the correction has been more significant at 41.35% |
| More “U” than “V” bottom | Yes |
| Decline < 50% | Yes, 41.35% |
| Decline < 2.5X market | Yes, it went down to its lowest with the market, but turned higher before the market recovered and has outperformed it since. |
Cheat Criteria
| Pause in right side cup uptrend | Yes, as noted on the chart |
| 1/3 – 1/2 way up right side | Yes |
| Pause contained within 5-10% range | No, 17.03% |
| Pause drifts down to lower low | Yes |
| Price range tight | Yes, at the bottom of the cheat |
| Volume dried up | Yes, at the bottom of the cheat |
Handle Criteria
| Upper 1/2 of cup | Yes, at top of cup |
| Above 50-day MA | Yes |
| Price drift down to lower low | Yes, so far. |
| > 1 week | It’s only been 3 days so far, still determining if it is a handle |
| Price range tight | No, still wide range |
| Volume dried up | No, still big volume and increasing |

