I might have missed this trade. Honestly, yesterday I got home late and by the time I was able to do my daily review I was too exhausted. When I can’t focus, I don’t force it, so I took the night off.
That being said, I’m looking at it now in terms of what I would have done. Yesterday was a good pivot volume day, which is what I was waiting for.
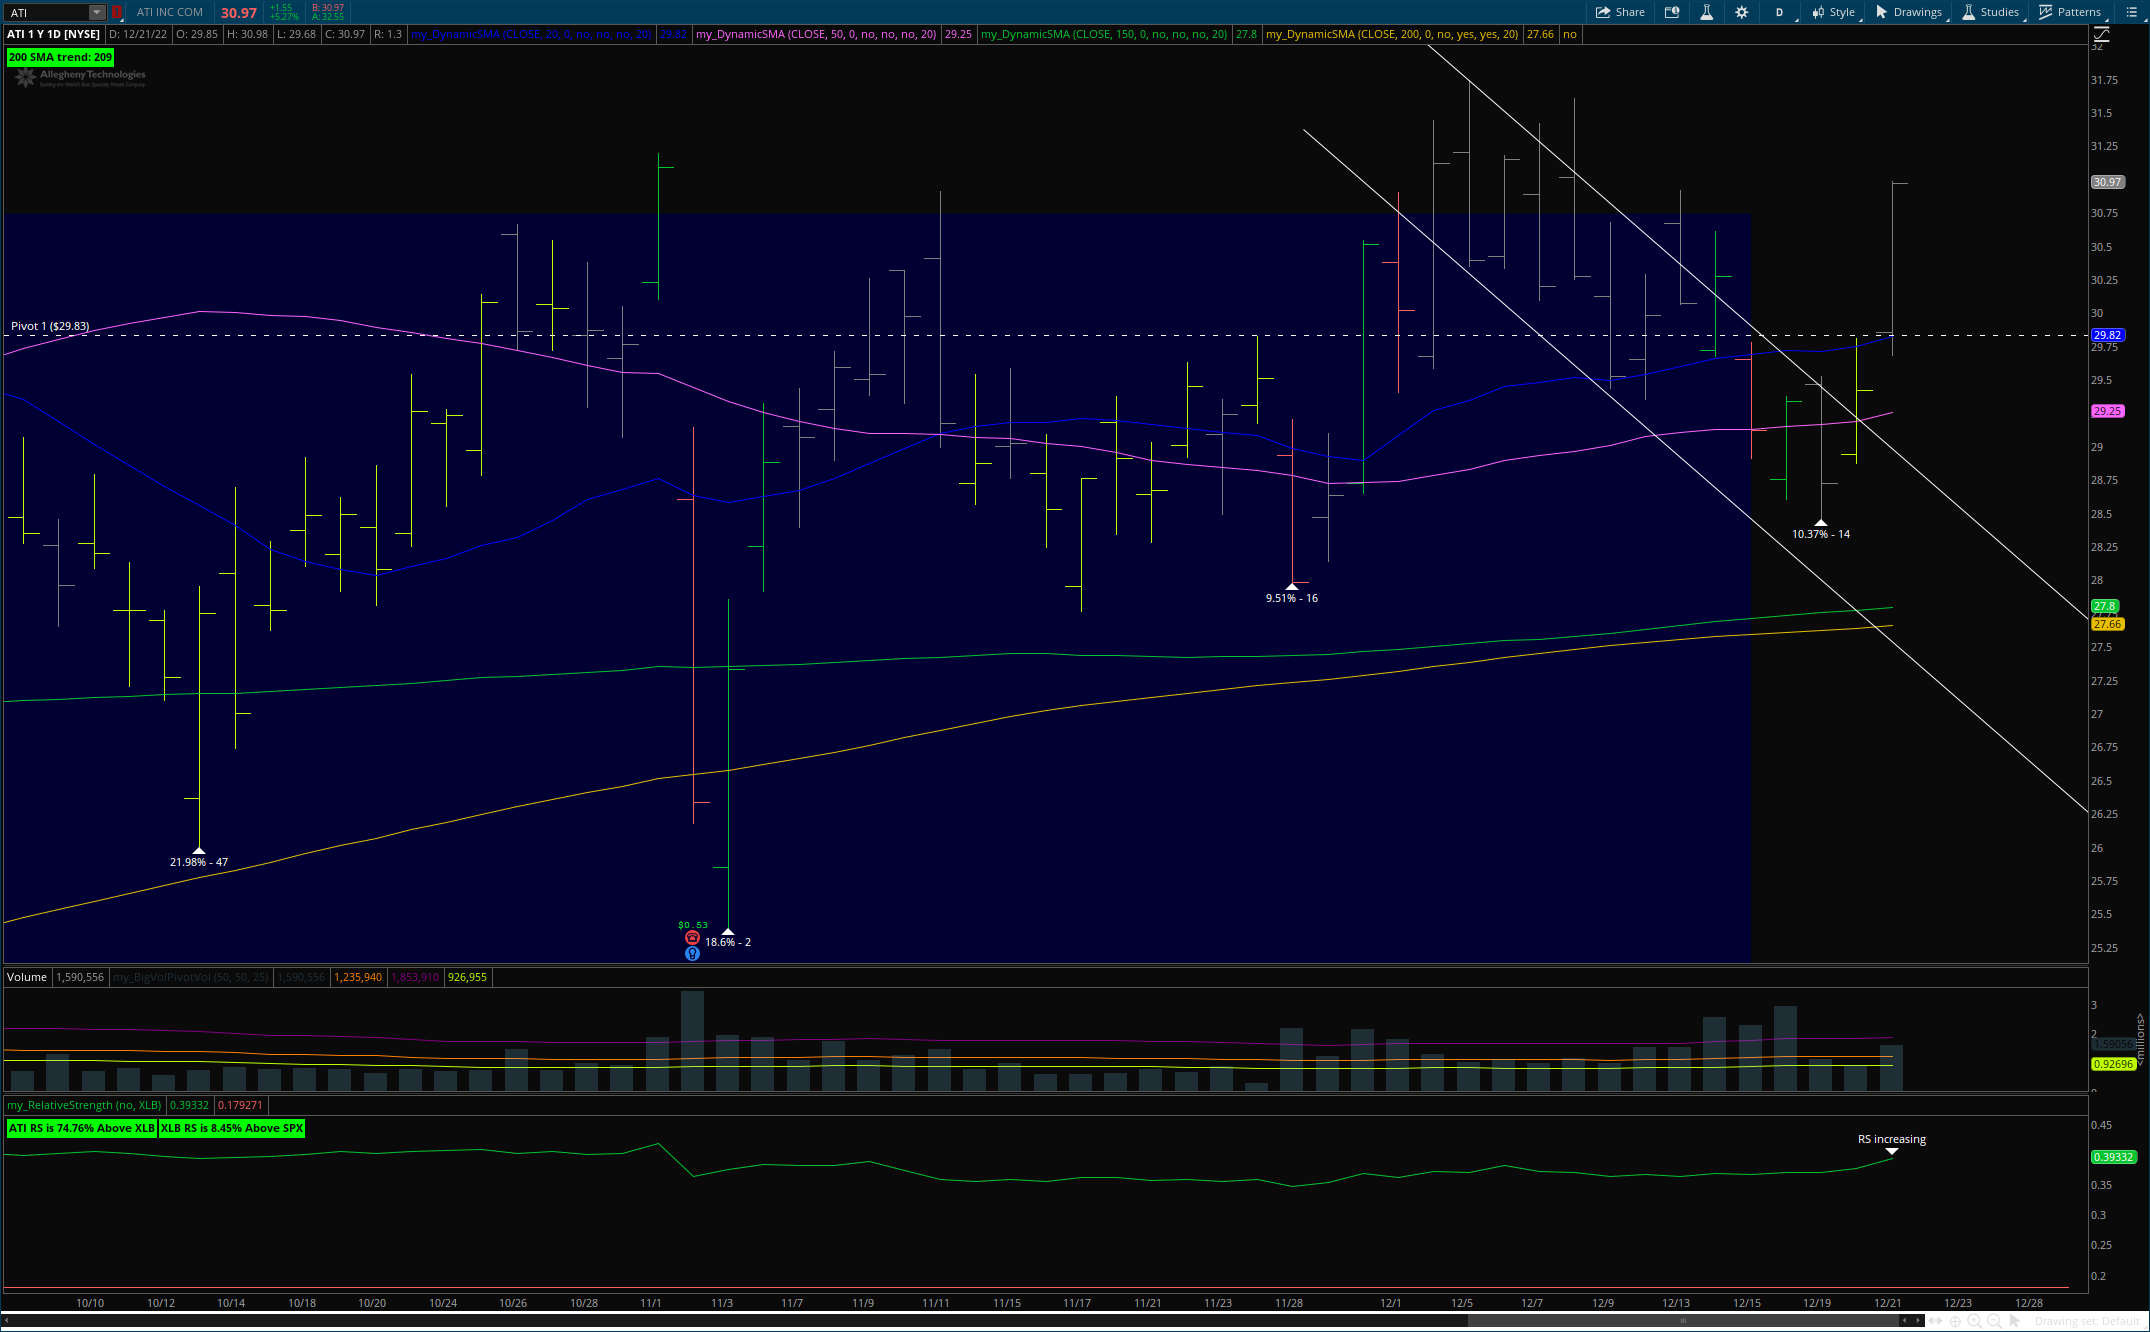
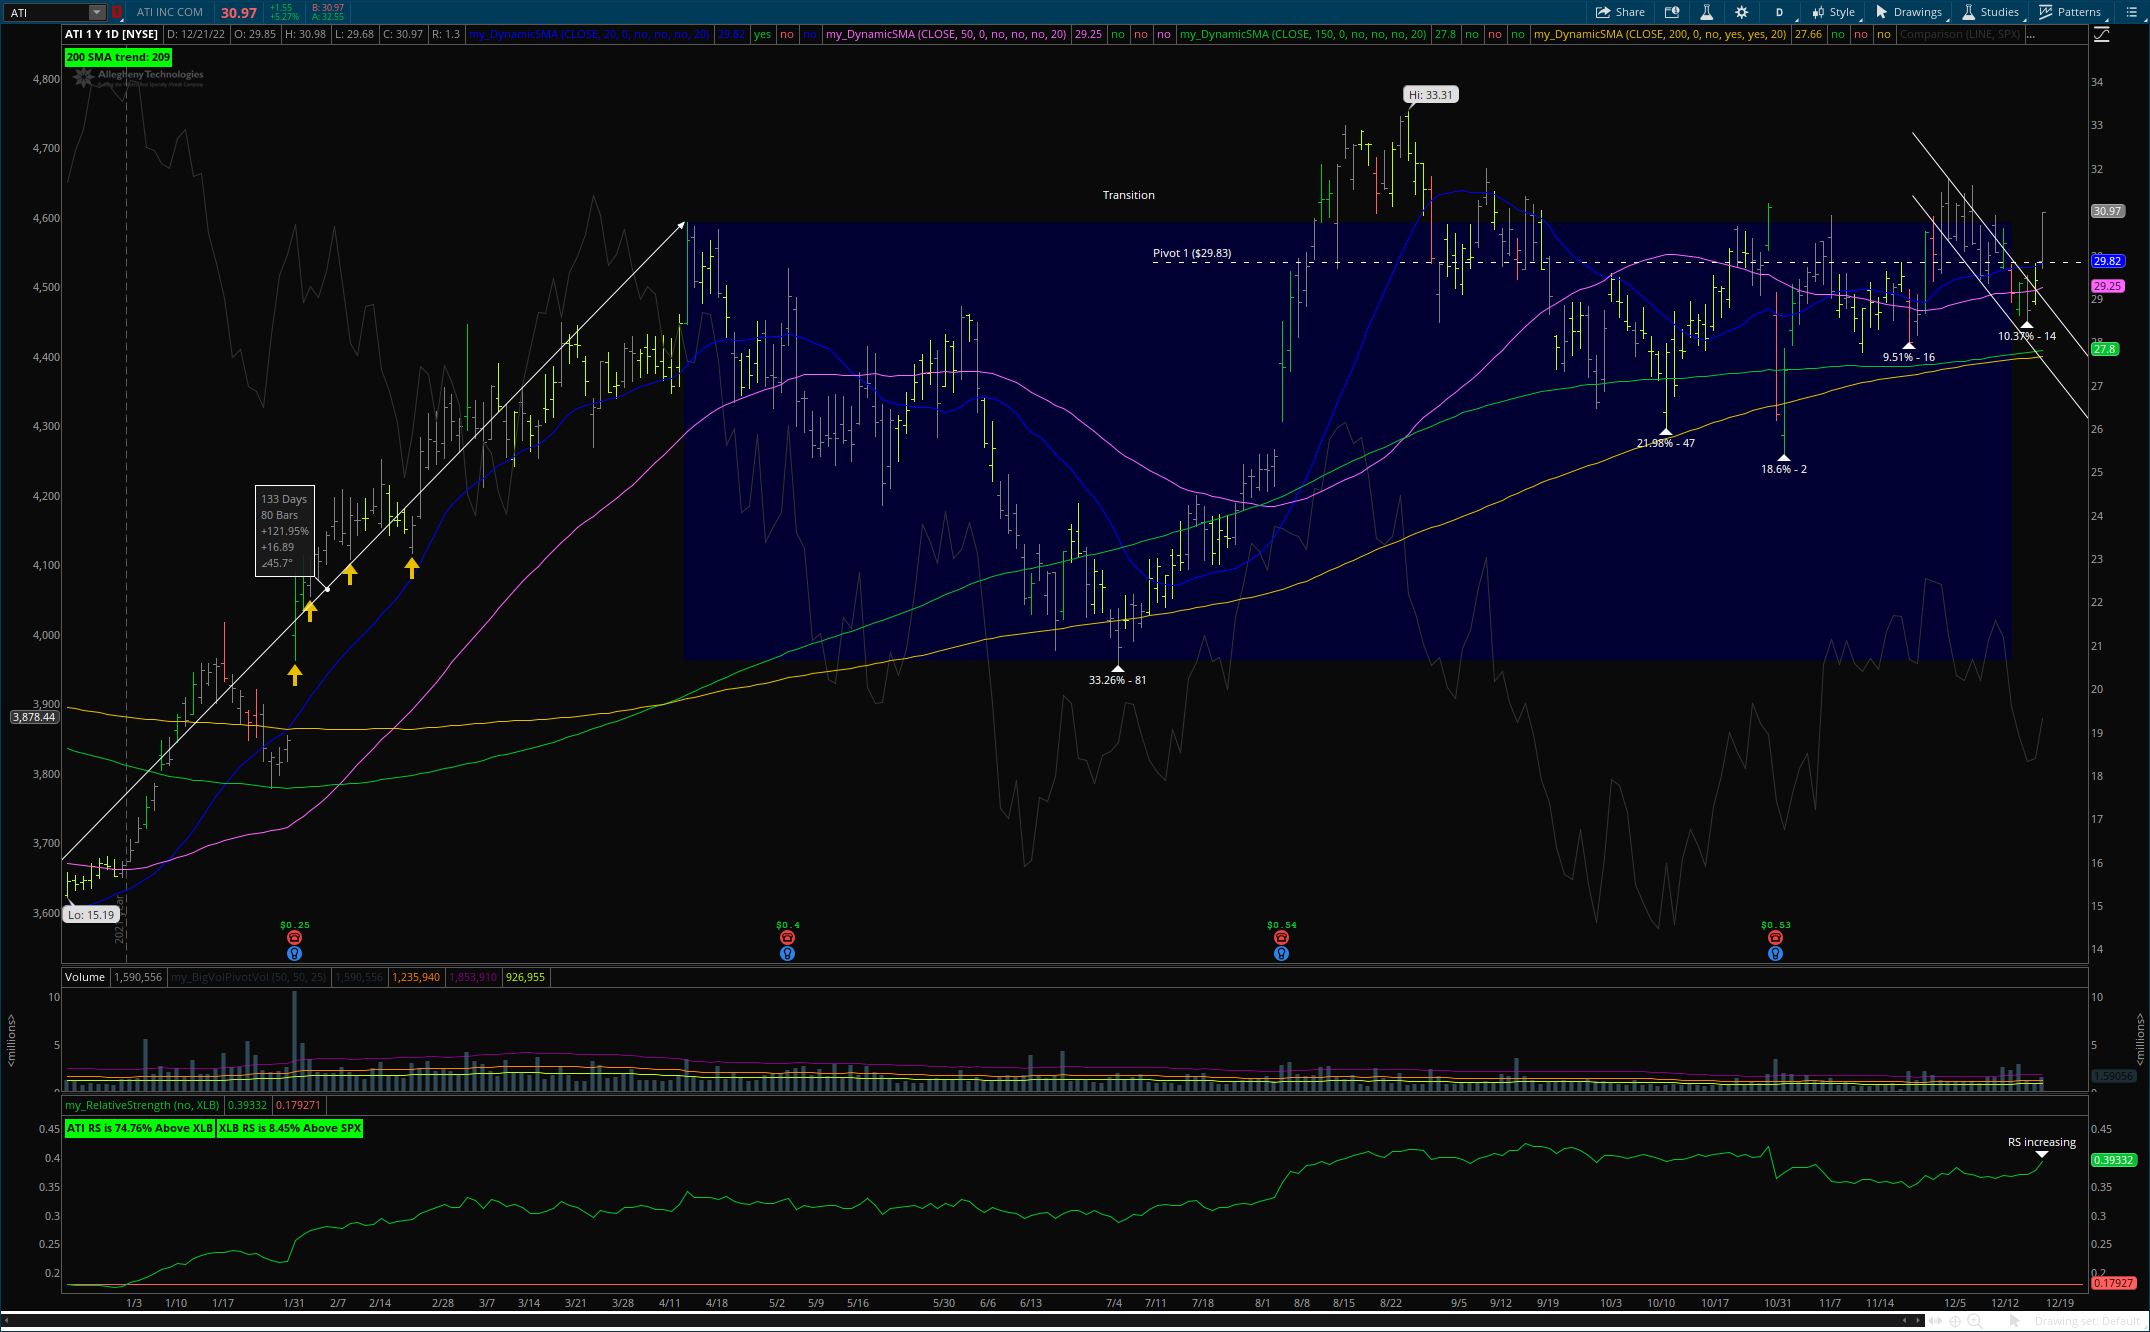
I zoomed in a bit to what I’m looking at:
- Start by looking at the VCP I’ve been tracking. You can see the percent drawdown getting less and the time of drawdowns also getting less. The percent decline on the last one was just a bit more than the previous, but the time was also just a bit less.
- Whenever I’m watching a contraction, I like to put a descending channel on it, just to get a better visual of when the contraction may be coming to an end and starting the next up move. You can see yesterday’s close was above the channel’s resistance, hinting the contraction may be over.
- Yesterday’s price bar is a lime color. Also look at the volume and you can see a lime trend line. That line is set to 25% below the 50-day volume average (the orange line). When the volume is at or below that lime line, the price bar becomes lime. That helps me visualize the volume and price relationship better. Anyway, when I’m looking for an entry point, I wait until I get a lime bar, like the one yesterday telling me volume is very low and supply may be dried up.
- Also, look at the RS rising on the move out of the channel. Though, it should be noted that the RS I’m looking at isn’t against the SPX like most other people seem to do. ATI is in the Materials sector. So, I am comparing the RS of ATI to that sector. Then I look at how that sector is performing against the SPX. ATI is strong and strengthening within its sector. The one drawback is that the Materials sector only outperforms the SPX by just over 8%. Nevertheless, ATI is outperforming the SPX by 81.92% as of today. That seems really good, but keep in mind the sector barely outperforms the SPX, which could be a liability despite the over strong RS number.
- So, back to yesterday. I got my pivot volume, the RS is increasing, it broke out the contraction channel and closed back above the 50-day MA (magenta line). If I would have seen all that yesterday, I would have placed a stop/limit buy order. My stop would have been at yesterday’s high, which would have been $29.83. I would have to go figure out what my limit would have been based on my position size calculator. I’m not able to watch the markets all the time, especially at the open, so I had to improvise my buy strategy. The idea is, if the next day the price moves back through the high of the previous day, then the order becomes a limit order. If the next ask is at, or better than the limit, the buy is executed. This gets me in the trade on strength but won’t chase a gap up over the limit. The range between the stop and limit is calculated so that at any price between the two, my position size stays the same. The limit is set at the highest price I can buy before the cost would decrease my position size to maintain the same risk. Finally, I always set my max risk to 8%. Therefore, I make the order so that a stop loss is automatically set 8% below the purchase price when the order is executed.
Now, after all of that, today my trade would have executed, assuming, at the stop price. I’d now own however many shares at $29.83 and I’d already be sitting on a healthy ~5% gain. Since my max risk is 8%, I’d be more than halfway to 1R in just one day.
The next trick is follow-through. Today’s move was on above average volume, which is good, but not big volume. In the chart above, you may have noticed the red, green and gray bars, along with the lime. Also, there is a plumb-colored trend line in the volume graph. Similar to the lime line, that represents 50% above the 50-day volume average. I call volume that high “big” volume. When I get big volume, the bar is red or green to indicate an up or down day. When I see red and green bars, I know those are the big volume days and what direction they are in. When the volume is above pivot volume, but lower than big volume, the bar is gray. I consider those normal days. Today was on the high end of normal.
So far this is looking good, and even though I didn’t actually get in the trade, I’m pretty stoked that my method seems to be working, not only making a good move up, but timed pretty perfectly. Of course, that could all change tomorrow, but as of now I’m pretty proud of myself.
