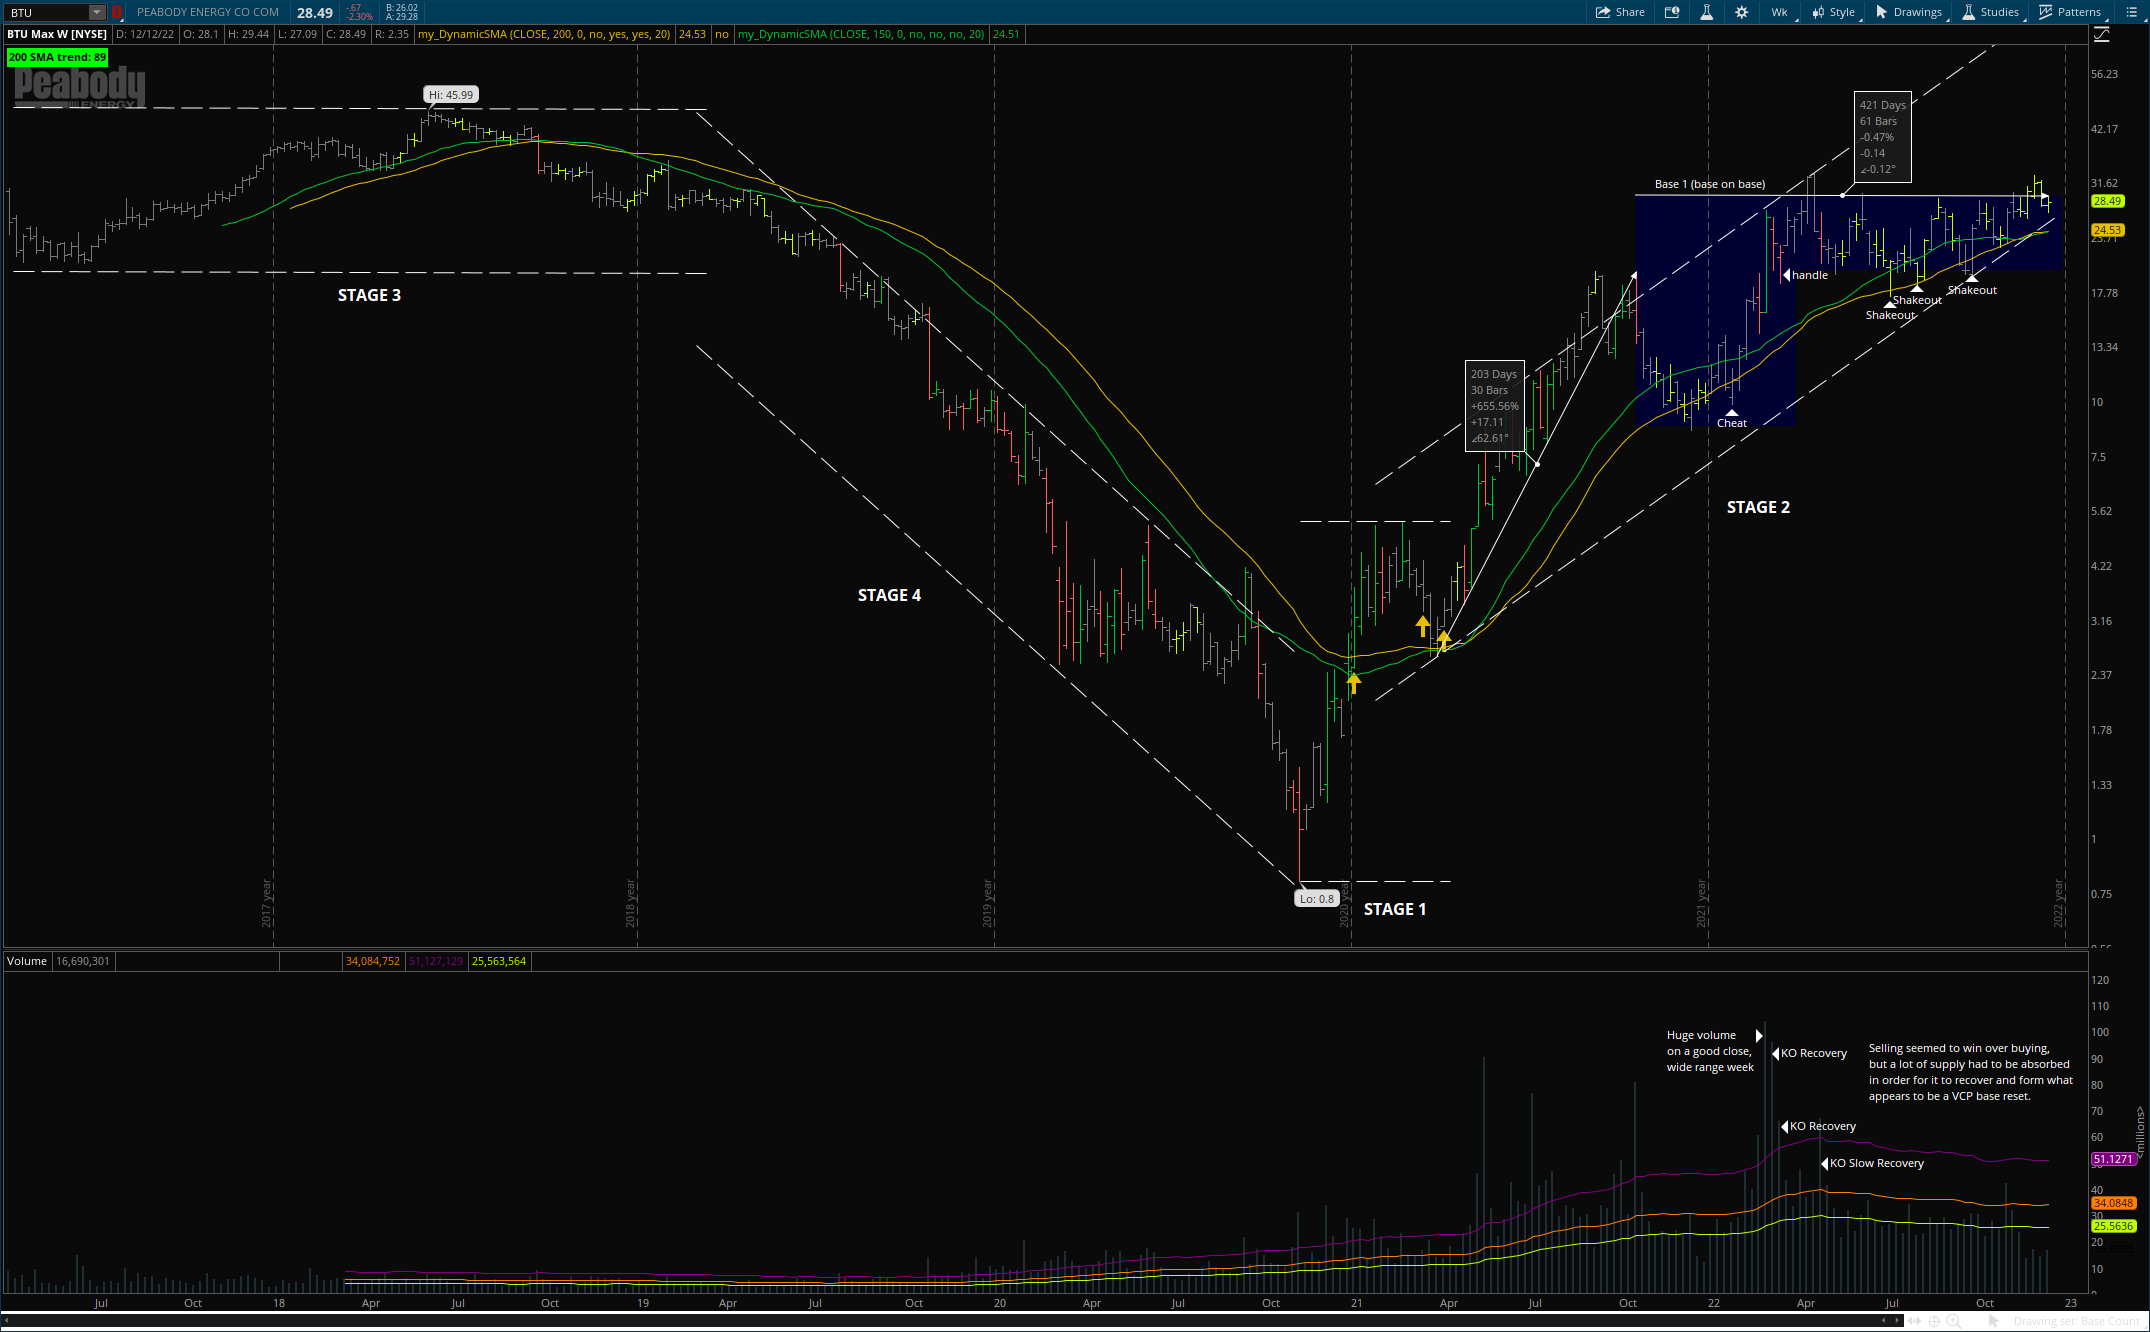
After a pretty massive 655% gain with big volume last year to start its stage 2, it went into a big cup and handle base 1. From its peak to the bottom of the cup, it fell about 56%. However, it staged a good recovery to form the right side of the cup. Perhaps that 56% decline created too much overhead supply, because it failed to break out as sellers prevented it.
However, it seems to have reestablished itself and is now creating a base reset. The new base is looking like a classic VCP. Though, it still seems too volatile at the moment. I’m watching for that volatility to die down. The volume has been low, but I’d like to see the price ranges tighten up a bit.
Base Count
Base Structure
| Identifiable base on weekly and daily | Yes, looks like a very long base 1, which is a base on base. |
| Prior up-trend of at least 30% | Yes, 655.56%. |
Length of base
At least 9 weeks ascending base At least 7 weeks for all other bases | 84 weeks. |
Contain elements of strength:
RS at new high tight price ranges KO Recoveries | Big KO recoveries. Implies that there was a lot of buying in the volume which eventually absorbed a lot of the supply and has since recovered. Institutions were likely using the selling pressure to accumulate more. |
Contain elements of support:
Base on top of base Price above 40-week MA | Price above 40 and 30-week MA’s and also coming down to support of the stage 2 up channel. This looks like a base on base where a big C&H failed and reformed as a VCP. |
| Shakeout near low of base | Yes, 3 in VCP. |
| Handle area within upper half of base that drifts down on lower-than-average volume | No, volatility is still too large but decreasing |
| Volume surge of 50% above average at pivot | The pivot hasn’t formed yet. |
Fundamentals
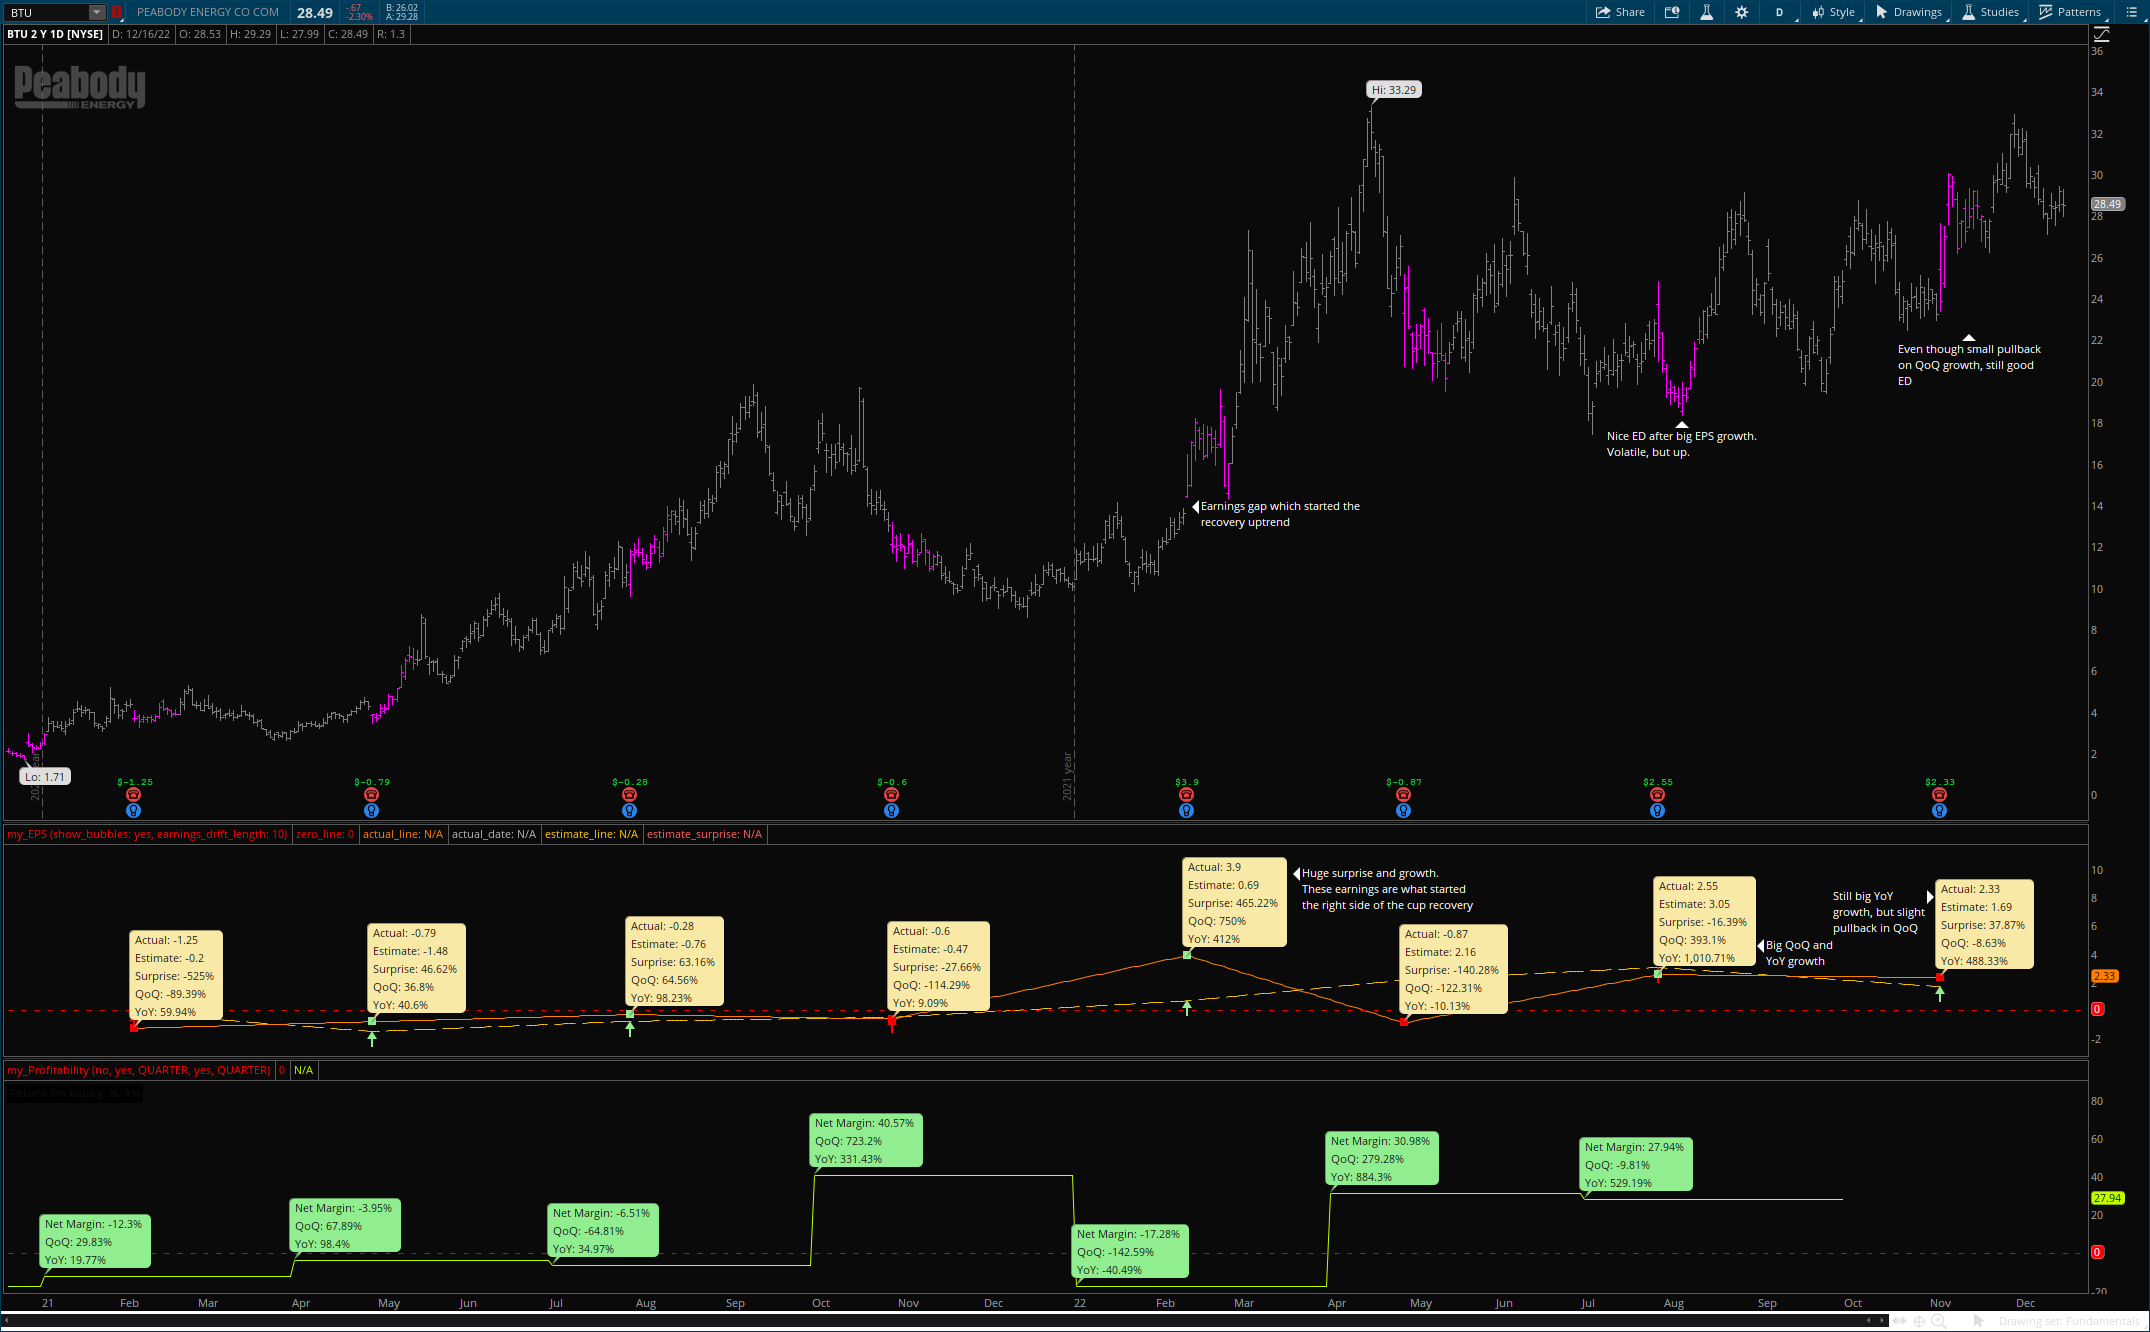
| Past 2 quarters EPS growth >= 25% | No, this latest Q was -8.63% growth, even though it was a 37.87% surprise. |
| Past 2 quarters margin growth >=25% | This are in-line with EPS. A setback this Q, but big growth last Q. |
| EPS growth >= 25% in past 3 – 5 years | This lates Q was QoQ negative growth, but still good growth YoY. The last 3 of 4 Q’s showed YoY growth. |
| EPS surprises | The 2 Q’s prior to this Q showed negative surprises, but this Q was a good surprise. |
| EPS break out | 3Q’s ago was a BO when it first became profitable. |
| ROE >= 17% | Yes, 66%. |
| Earnings drift | ED for the last 2 Q’s have been good, leading to new highs. Even after this Q’s negative growth, the ED was higher. |
Technicals
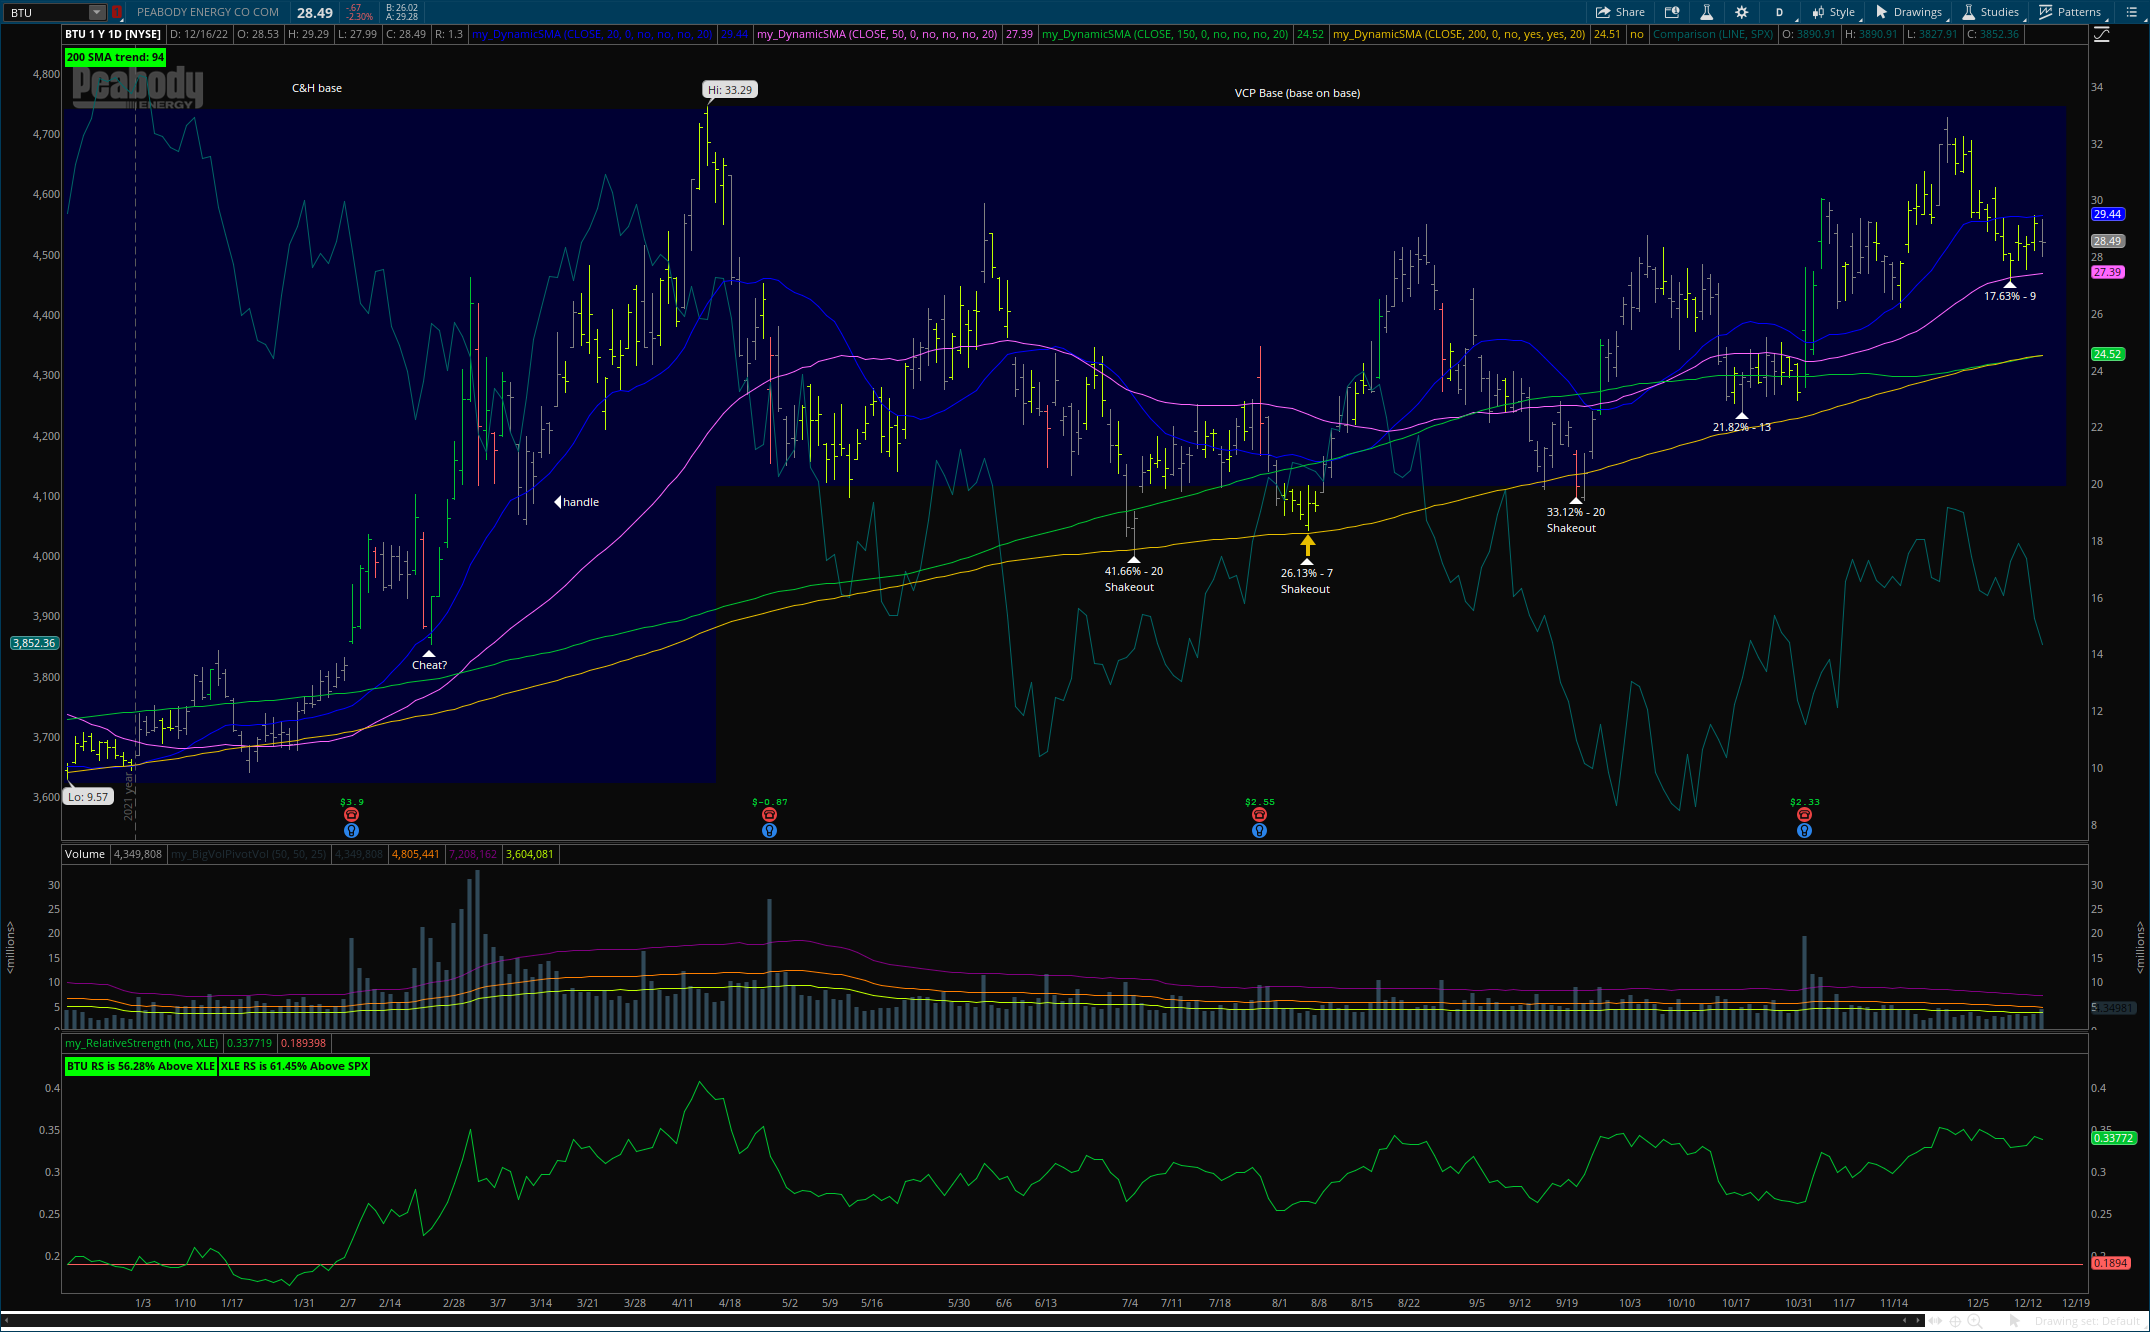
As mentioned earlier this looks like a base on base. The first was a failed cup and handle, which then did a base reset inti the current VCP.
VCP Criteria
| Decreasing volatility from left to right | Yes, as shown on the chart the contractions are getting smaller and the time of contraction is getting less. |
| 2 – 6 contractions (typically 2 – 4) | Just completed contraction 5 |
| Each contraction is roughly 1/2 the previous | No, they are more than 1/2. |
| Deepest contraction < 50% | No, the deepest contraction was the bottom of the cup, which failed and seems to be resetting now. The contraction was 56.49%, but recovered. |
| Deepest contraction < 2.5X the market decline | No, the deepest contraction was between 3 and 4X the market correction. However, it has recovered more than the market and remains stronger than it now. |
| On right side tight price ranges from high to low of range | No, not tight enough yet. |
| On right side lowest volume in base | Yes, especially on the weekly. |
| Rising RS as emerging from base | No, the RS is high but pulling back slightly here. |